

Q - What is a function?
A - A function is a relationship or expression involving one or more variables.
Q - What is a linear function?
A - A linear function is a function where the input and output values increase or decrease at a constant rate, or slope. On a graph, a linear function is a straight line.
Q - What does a linear function look like?
A - A graph, table, or equation:
GRAPH

TABLE

EQUATION
Q - What is the equation for a linear function?
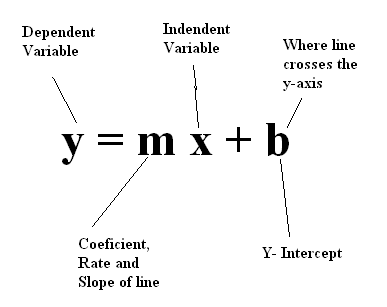
A - Dependent variable/output = slope/rate of change x independent variable/input + y-intercept OR
OR
y = mx + b
Q - What is slope?
A - Slope is the constant rate of change represented by m in the linear equation y = mx + b. The slope is calculated by rise/run or output/input, or (y2 - y1)/(x2 - x1).
GRAPH

TABLE

m = 3/1
|
EQUATION


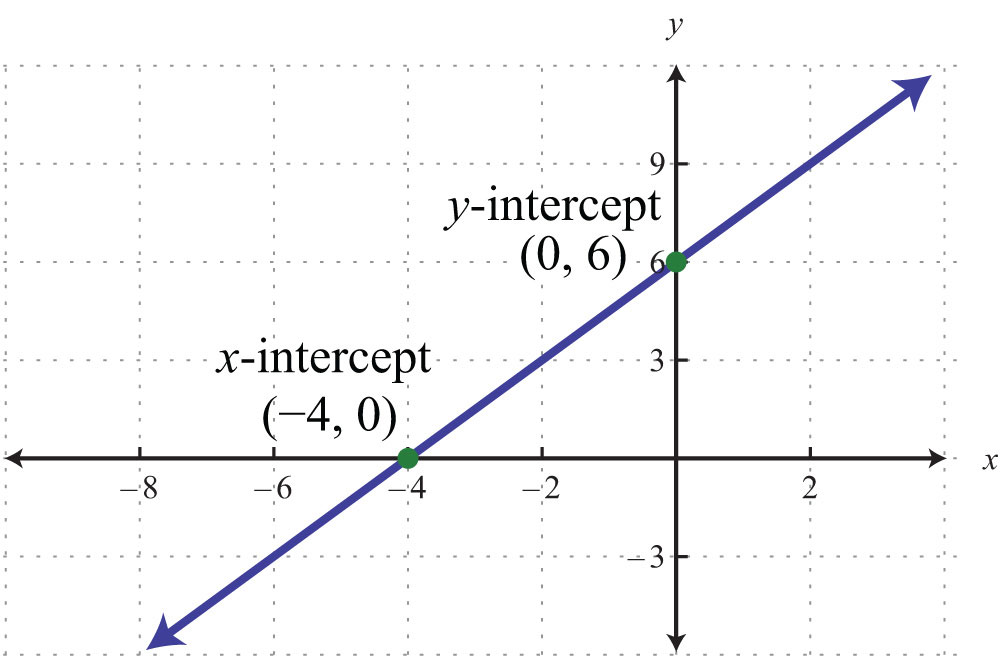
Q - What is the y-intercept
A - The y-intercept is the point at which a line intersects the y-axis on a graph. This is the value of y when x = 0.
GRAPH
TABLE

EQUATION

To find b, set x = 0, calculate m and isolate b so that b = y/mx
dave,
ReplyDeletenice job. your images do a good job of explaining the concepts.
professor little